May 2025
Davies, T.W. and Smyth, T. (2025), Darkening of the Global Ocean. Glob Change Biol, 31: e70227. https://doi.org/10.1111/gcb.70227
This study used 20 years of Aqua MODIS data of the diffuse attenuation coefficient of light over the global oceans and found that it had increased across 75,341,181 km2 (21%) of the global ocean between 2003 and 2022, resulting in photic zone (areas with high productivity) depths reducing by more than 50 m across 32,449,129 km2 (9%) by area. Their results demonstrated that this darkening is not limiited to the coastal zones. This darkening of the ocean could have profound affects on the global ocean ecosystem.

Figure: Darkening of the Global Ocean. (A) The rate change (units per year) in the diffuse attenuation coefficient for downwelling irradiance at 490 nm [ΔKd(490)] measured from MODIS Aqua between 2003 and 2022 in 9 km resolution. Reds indicate regions where Kd(490) is increasing (oceans are getting darker), while blues indicate regions where Kd(490) is decreasing (oceans are getting lighter). White indicates regions where there was no statistically significant change in Kd(490) over the period 2003–2022. Values of ΔKd(490) were derived for each 9 km resolution pixel using quantile regression to the median performed on the fitted values of an Autoregressive Integrated Moving Average (ARIMA) model of annual averaged Kd(490) data. (B) International Hydrographic Office sea regions ranked according to the percentage of their area over which Kd(490) is increasing. Numbers inset above bars give the absolute area where Kd(490) is increasing in 10,000 km2.
February 2025
Ocean's Largest Chlorophyll-rich tongue is extending westward (2002-2022)
Peng, S., Yu, X., Lee, Z. et al. Ocean’s largest chlorophyll-rich tongue is extending westward (2002–2022). Nat Commun 16, 103 (2025). https://doi.org/10.1038/s41467-024-55650-8
'Upwelling in the Equatorial Pacific nurtures an expansive, westward-stretching chlorophyll-rich tongue (CRT), supporting 18% of the annual global new production. Surrounding the CRT are the oligotrophic subtropical gyres to the north and south, which are suggested to be expanding under global warming. Yet, how this productive CRT has changed, expanding or contracting, remains unknown. By applying the empirical mode decomposition (EMD) method to 20-year monthly measurements of chlorophyll-a concentration from MODIS-Aqua satellite (2002-2022), we demonstrate that the CRT exhibited a significant westward extension, at an average expanding rate of 1.87 ( ± 0.82) × 105 km2/yr. The westward extension of the CRT is attributed to strengthened equatorial upwelling and a strengthened South Equatorial Current from 2002 to 2022, driven by intensified easterly trade winds as the Pacific Decadal Oscillation predominantly remains in its negative phase during this period. Interestingly, EMD analysis on central locations of the Pacific gyres suggested simultaneous extension of the gyres and the CRT during 2002-2022, with the gyres extending poleward. Our findings imply a broader cover of productive water along the equator, while its impact on tropical climate, ecosystems, and carbon cycle deserves further investigation.'
Aqua MODIS Level 3 monthly Chl products (version R2022.0) was used in this study.
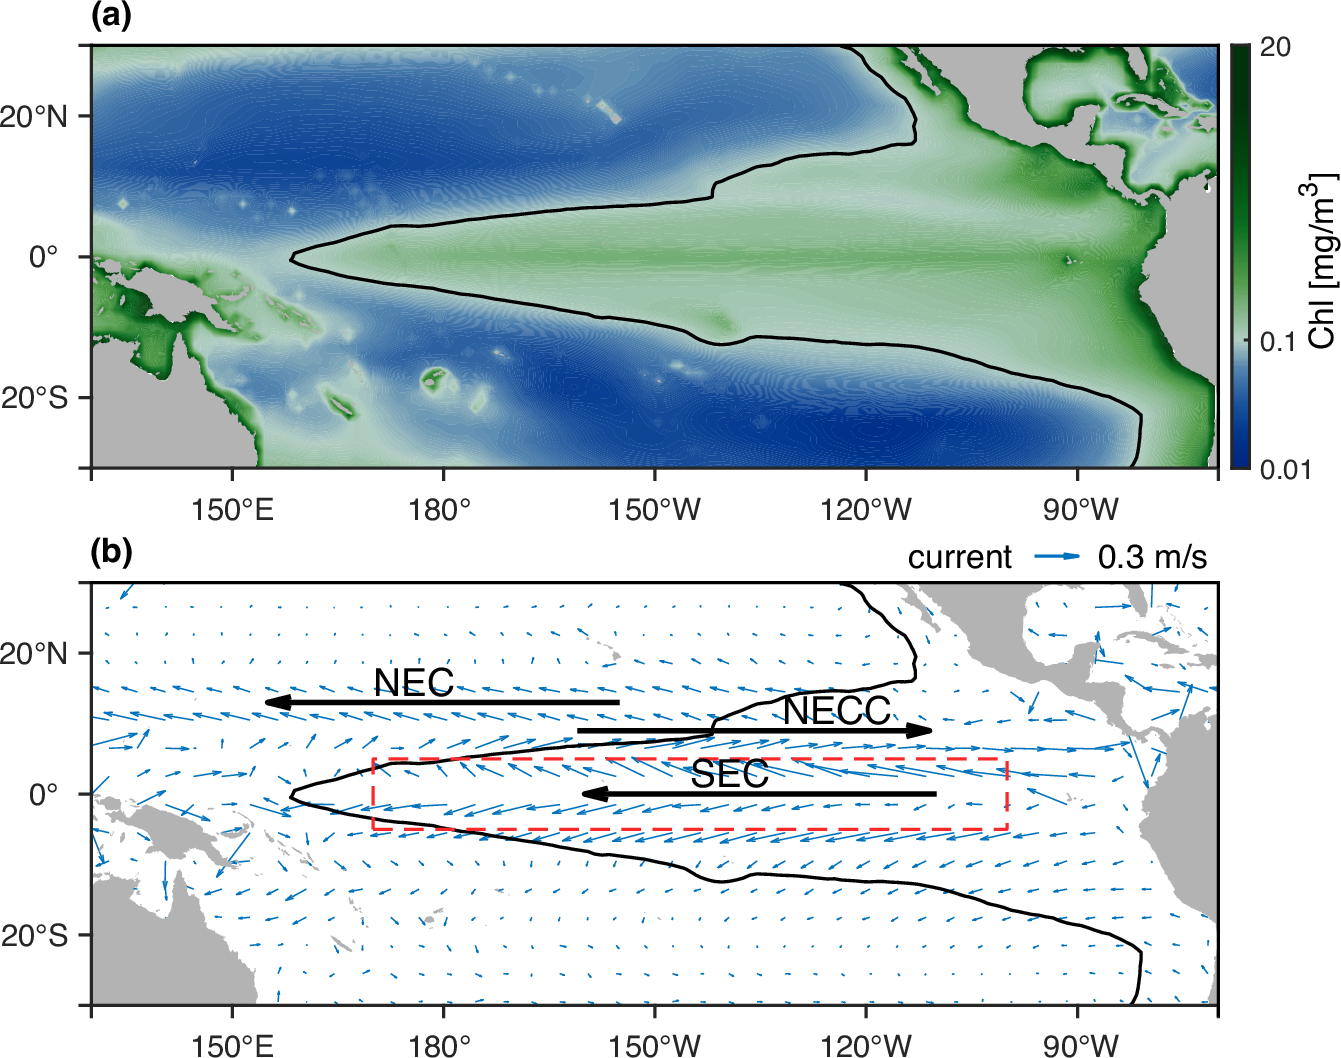
Figure: Climatological mean (a) surface chlorophyll concentration (Chl, mg/m3) and (b) current fields (m/s) between August 2002 and July 2022 from Aqua MODIS. The CRT climatology boundary is delineated with the black curve, representing the Chl isoline of 0.1 mg/m3. The major surface currents are shown in solid black arrows in (b), including North Equatorial Current (NEC), North Equatorial Counter-Current (NECC) and South Equatorial Current (SEC). The area enclosed by the red dashed lines in (b) denotes the central positions of SEC (5° S-5° N, 170° E-100° W).
November 2024
The fastest-growing and most destructive fires in the US (2001 to 2020)
Jennifer K. Balch et al., The fastest-growing and most destructive fires in the US (2001 to 2020).Science386,425-431(2024).DOI:10.1126/science.adk5737
"The most destructive and deadly wildfires in US history were also fast. Using satellite data, we analyzed the daily growth rates of more than 60,000 fires from 2001 to 2020 across the contiguous US. Nearly half of the ecoregions experienced destructive fast fires that grew more than 1620 hectares in 1 day. These fires accounted for 78% of structures destroyed and 61% of suppression costs ($18.9 billion). From 2001 to 2020, the average peak daily growth rate for these fires more than doubled (+249% relative to 2001) in the Western US. Nearly 3 million structures were within 4 kilometers of a fast fire during this period across the US. Given recent devastating wildfires, understanding fast fires is crucial for improving firefighting strategies and community preparedness."
MODIS data, specifically the Burned Area Product was used in this study.

January 2024
Continuity between NASA MODIS Collection 6.1 and VIIRS Collection 2 land products
Román, M. O., Justice, C., Paynter, I., Boucher, P. B., Devadiga, S., Endsley, A., ... & Wolfe, R. (2024). Continuity between NASA MODIS Collection 6.1 and VIIRS Collection 2 land products. Remote Sensing of Environment, 302, 113963. https://doi.org/10.1016/j.rse.2023.113963
A recent review and summary of current research by the NASA Terra Aqua Suomi-NPP Land Discipline Team has recently been published in regards to their efforts to provide continity of global land data products between two instruments: NASA MODIS and the Visible Infrared Imaging Radiometer Suite (VIIRS). The two MODIS instruments on Terra and Aqua have provided valuable data for more than 20 years, and as these satellite platforms age, it is imperative to maintain data continuity with other instruments in orbit, such as VIIRS. Hence, the land data products from MODIS are now being transitioneed to being producing using VIIRS data. This publications highlights the intercomparison and evaluation between these two products. The results provide primising levels of agreement and accuracy between the two products in in several cases. The image below shows an example of MODIS (MYD10A1) and VIIRS (VNP10A1, VJ110A1) product comparison of maps showing land surface classifciations between ocean, land, snow cover and clouds.
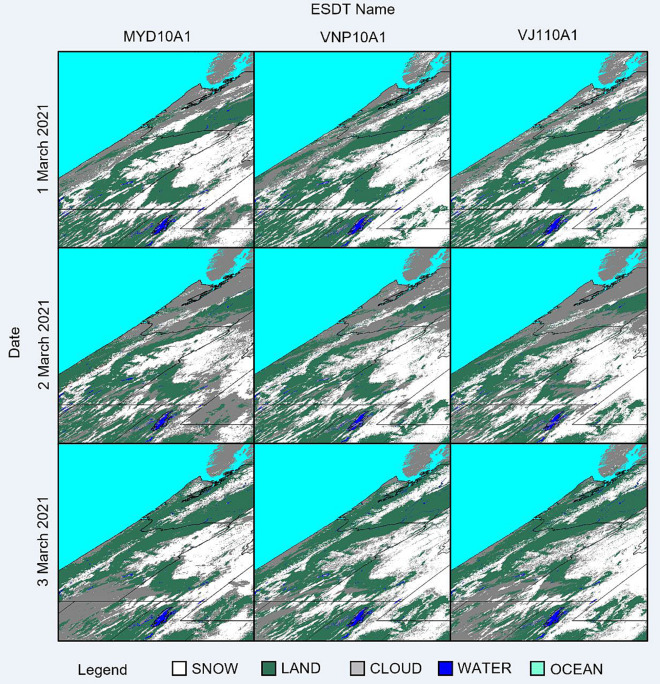
Binary snow cover extent (SCE) maps from MYD10A1F, VNP10A1F, and VJ110A1 for 1–3 March 2021 for tile h09v04 covering the northwestern USA.
July 2023
Global climate-change trends detected in indicators of ocean ecology
Cael, B.B., Bisson, K., Boss, E. et al. Global climate-change trends detected in indicators of ocean ecology. Nature (2023). https://doi.org/10.1038/s41586-023-06321-z
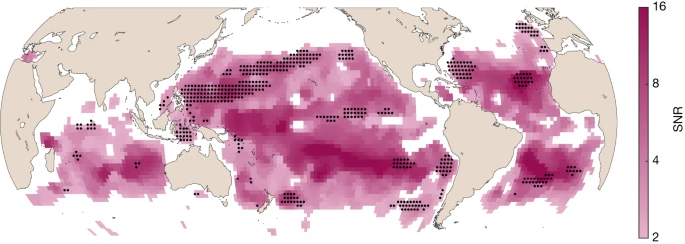
Figure: Map of locations where the ocean-colour trend SNR is higher than 2 for a 20-year annual time series. The intensity of the purple colour indicates the signal to noise ratio. Black stippling indicates regions with significant trends in Chl as well (12% of the ocean). MODIS-Aqua data from July 2002 to June 2022.
Climate change is altering the earth's oceans, specifically in marine ecosystems and it has been hypothosized that this could alter the ocean color. However, determining if this was occuring on a global scale has been difficult due to the lack of a long-term satellite data record, especially with intercalibration between different instruments being an issue. Having MODIS on Aqua for 20+ years has allowed for this type of study to take place, and for long term changes to be found.
A new study, published in Nature using Aqua MODIS reflectance data found that there are large areas of the global oceans where the color of the ocean has changed over the 20-year record and is becoming more green due to more phytoplantion. This change in ocean color is driven by climate change. This change is important because it alters the light environment of the oceans, which drive primary production and can lead to an overall change in the surface-ocean ecosystem, which could have potential effects on fisheries worldwide.
June 2023
Atmospheric nourishment of global ocean ecosystems
T.K. Westberry, et al., Atmospheric noursiment of global ocean ecysystems. Science 380, 515-519 (2023). DOI: 10.1126/science.abq5252
A new study by Westberry et al. published in Science titled, 'Atmospheric Nourishment of Global Ocean Ecoystems', detects the extent and magnitude of dust-deposition on the oceans globally. Dust-deposited on the ocean provides nutritents for phytoplankton. This new dataset was produced using Aqua MODIS data.

March 2023
Coastal phytoplankton blooms expand and intensify in the 21st century
Dai, Y.,Yang, S., Zhao, D. et al. Coastal phytoplankton blooms expand and intensify in the 21st century. Nature 615, 280–284 (2023). https://doi.org/10.1038/s41586-023-05760-y
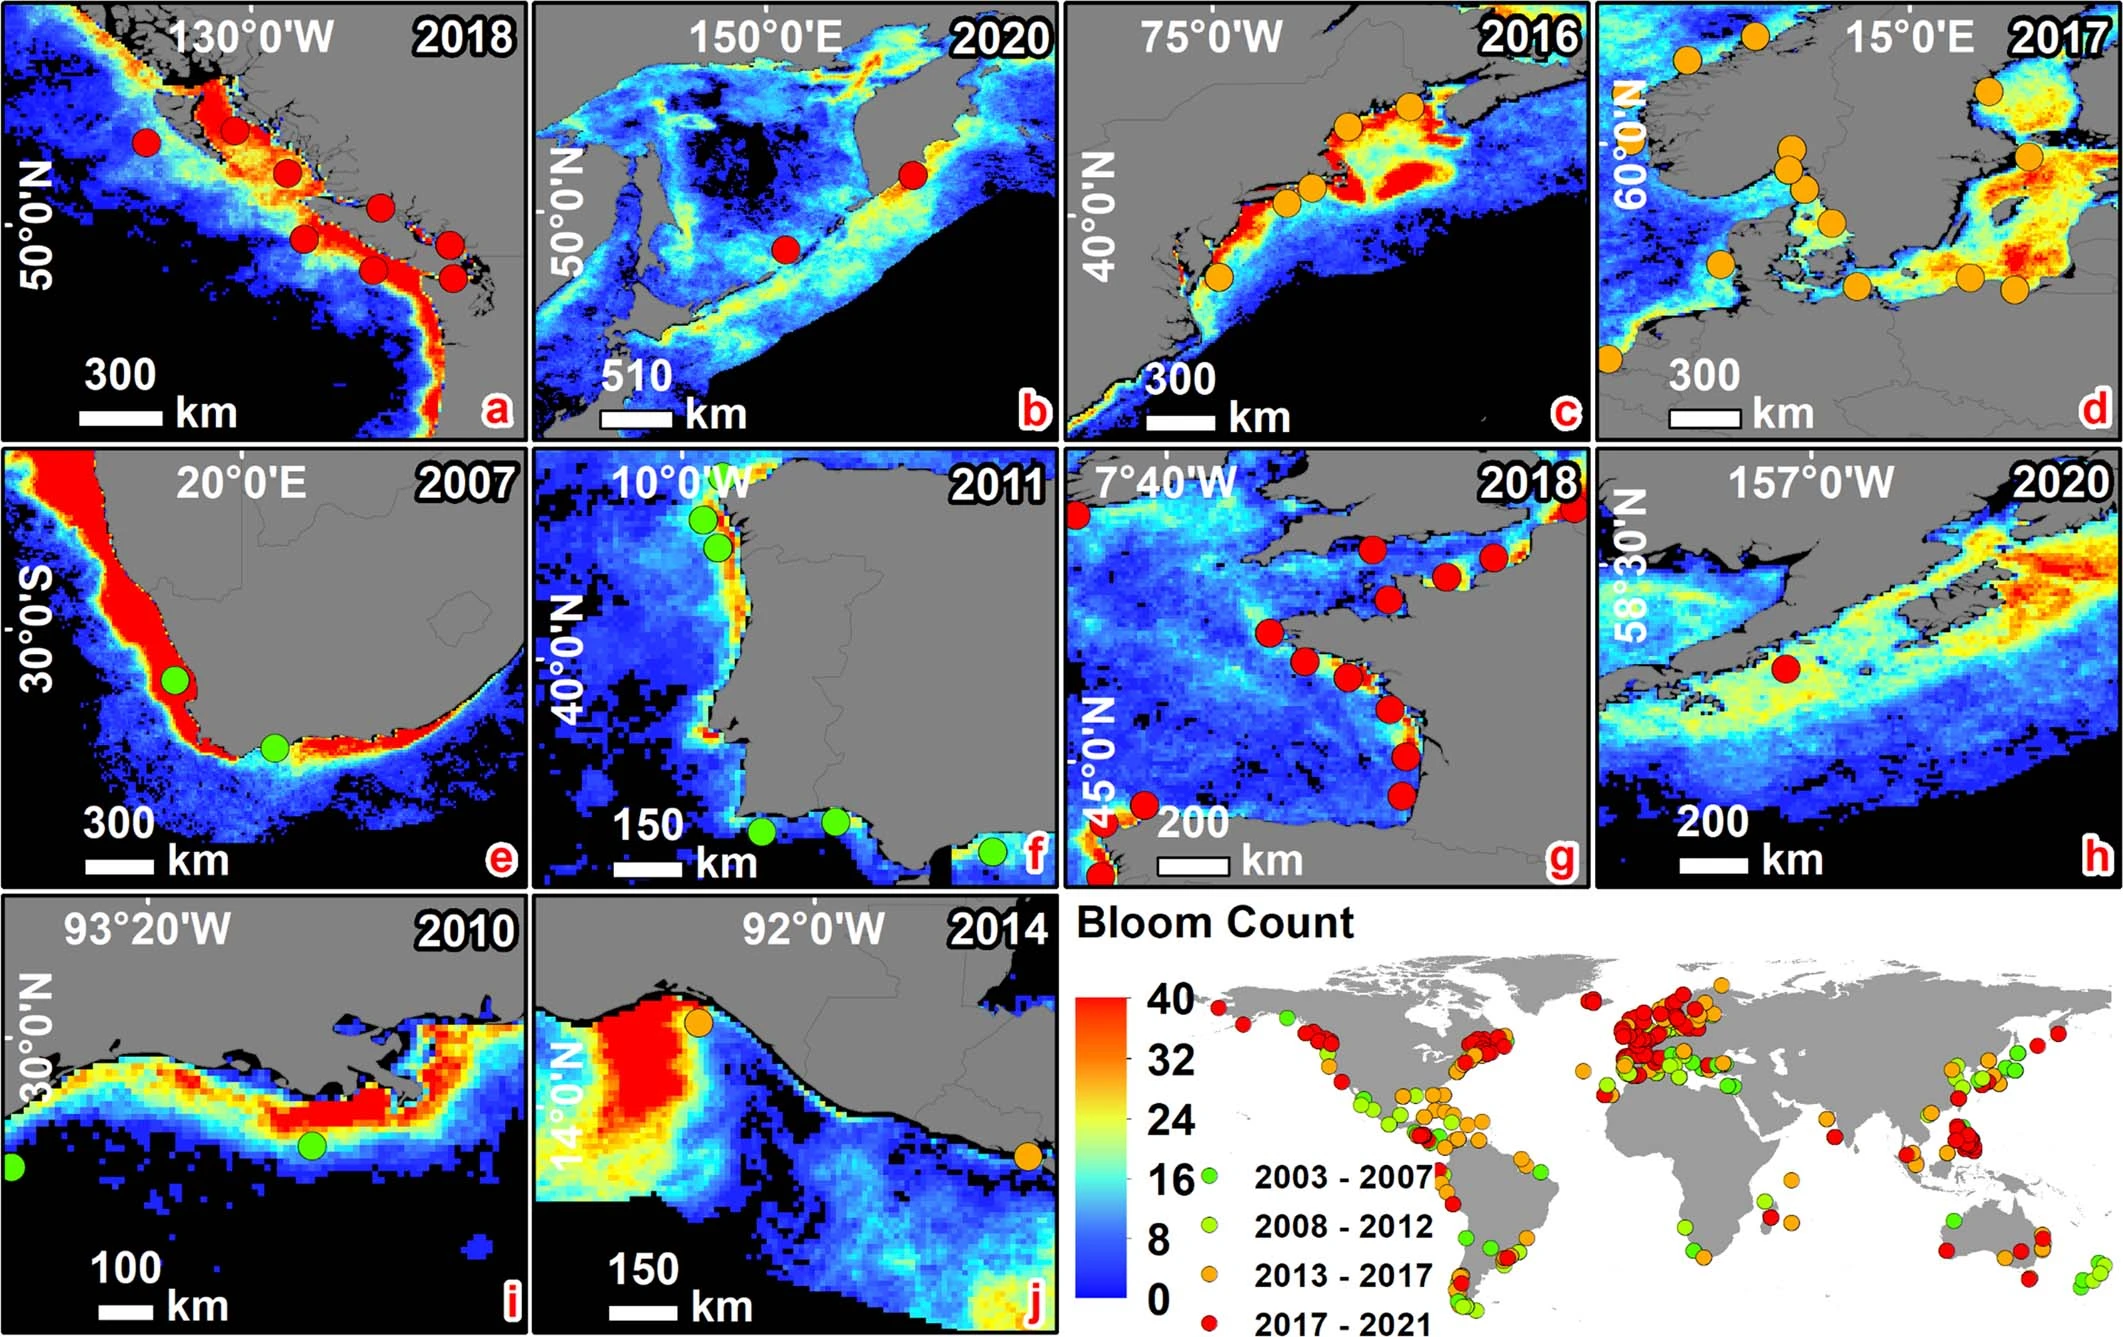
Figure: MODIS-dectected bloom count within certian years for several coastal regions with frequency reported blooms. The MODIS observational year is annotated within each panel, and overlaid points indicate in situ recorded harmful algal bloom events from the Harmful Algae Event Database (HAEDAT) within the same year. The lower right panel shows the locations of all the HAEDAT records that were used for algorithm validations in this study, which also demonstrates the increase in sampling effort in the most recent years.
A new study, published in Nature, found that globally coastal algae blooms are increasing in frequency and extent between 2003-2020. These blooms were detected by a algae bloom detection dataset, which was produced using 0.76 million MODIS-Aqua images. While some algae blooms are beneficial providing food to fisheries and the ecosystems worldwide, other blooms called 'Harmful Algae Blooms' are becoming more prevalaent and can put toxins in the food chain, affecting animals and humans, and can depelete the oxygen in areas creating 'Dead Zones' that can kill many species. This daily coastal phytoplanton bloom dataset is important because it can be used to inform future management and policy actions and provides locations and timing of these algae blooms.