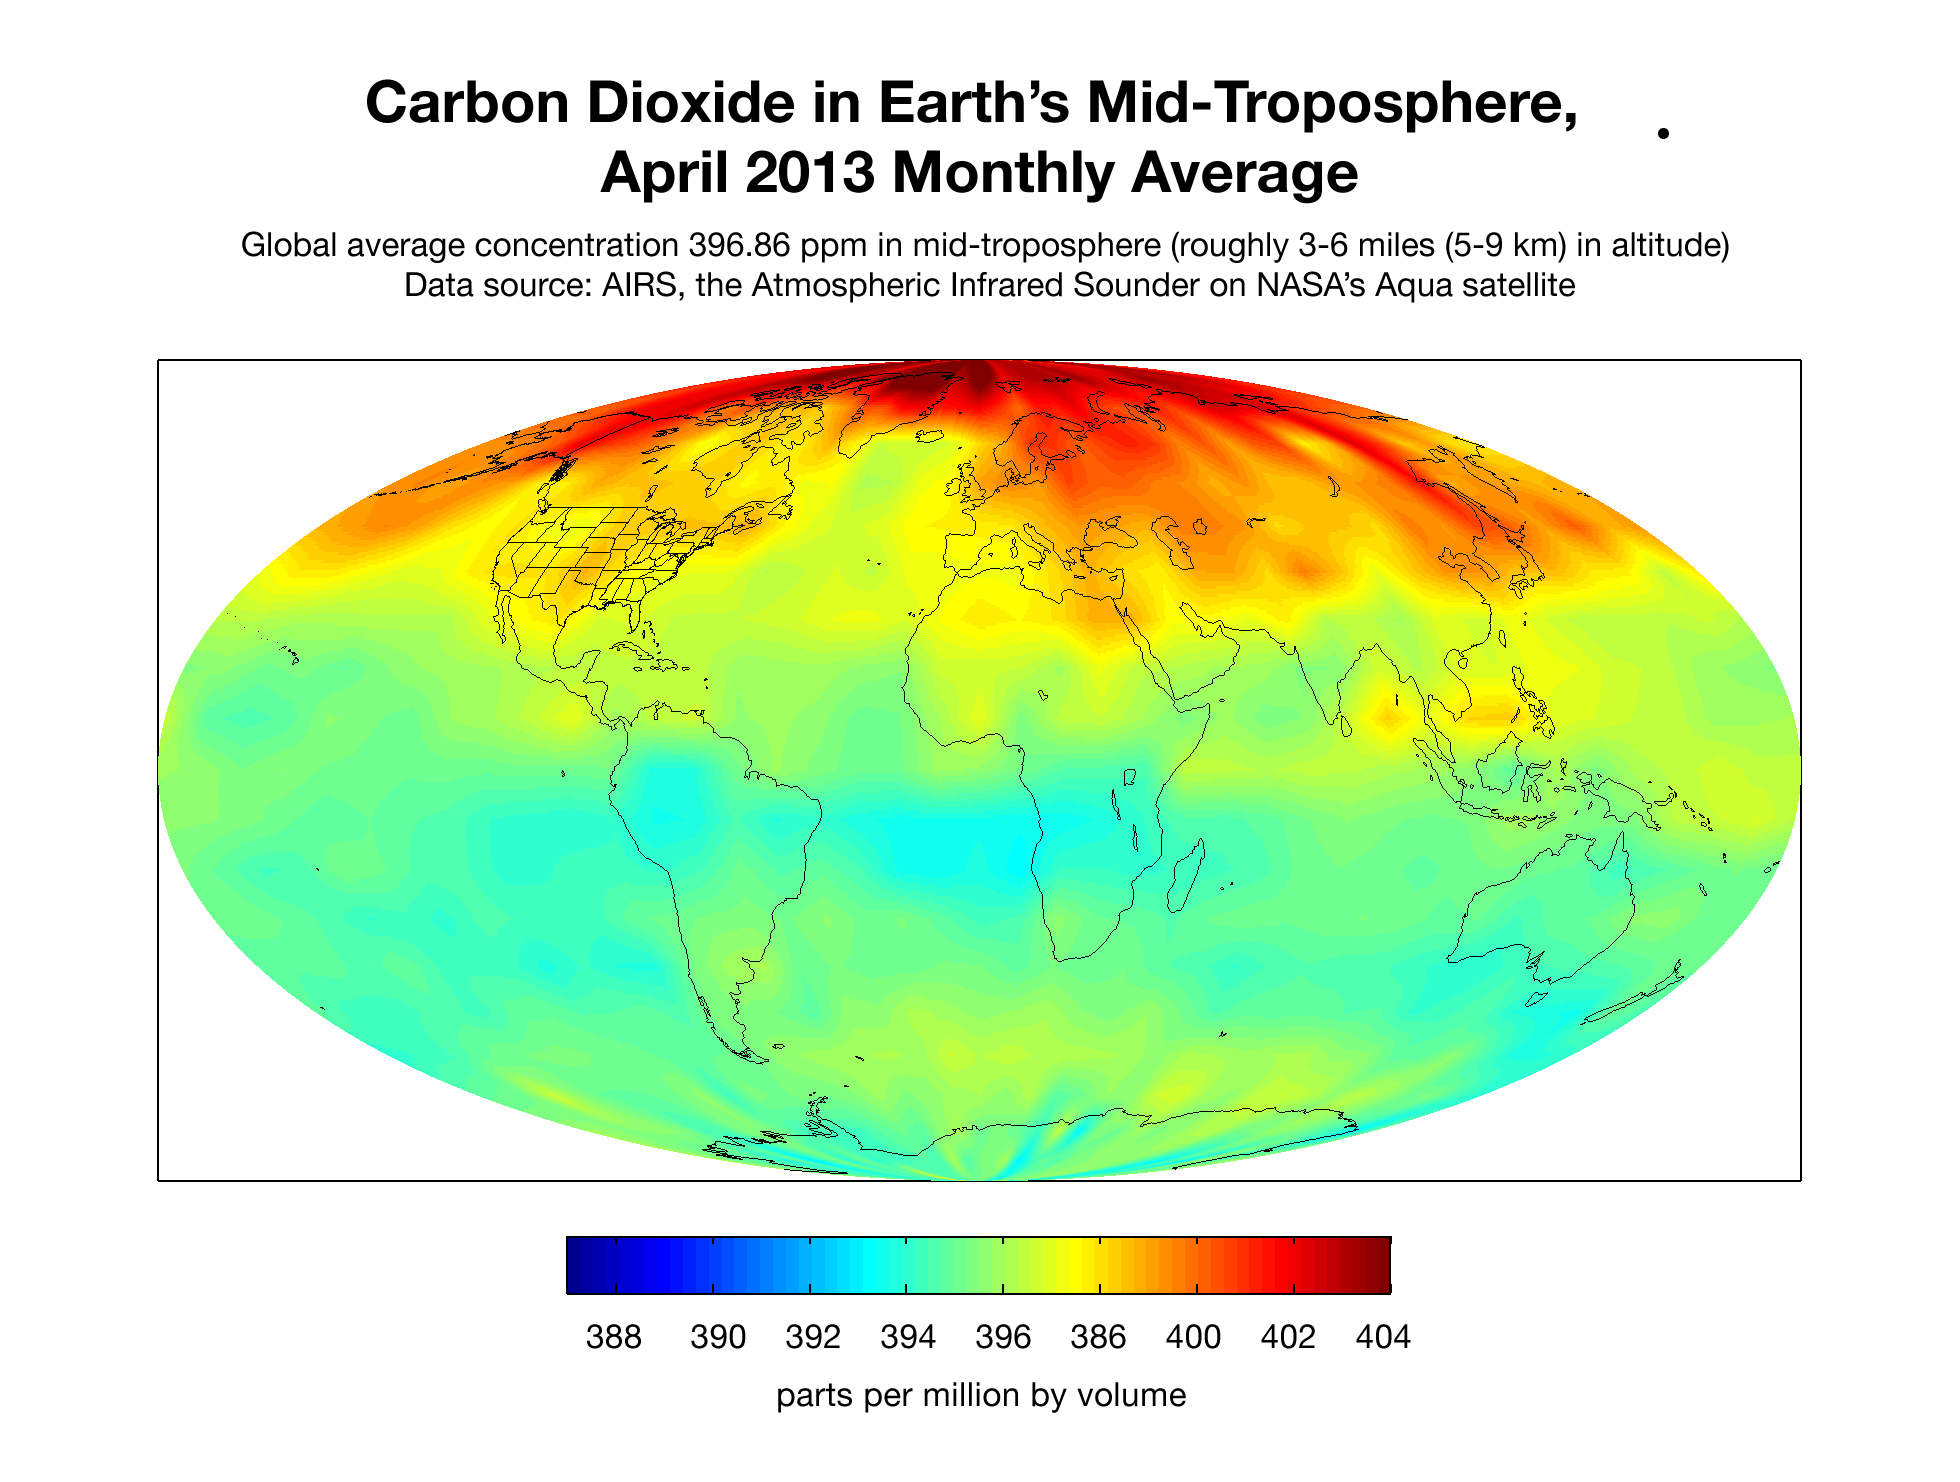
This map created with data from the Atmospheric Infrared Sounder (AIRS) on NASA's Aqua satellite shows the concentration of carbon dioxide in Earth's mid-troposphere, located roughly between 3 to 6 miles (5 to 9 kilometers) in altitude. Darker red colors correspond to higher concentrations of carbon dioxide, which are seen mostly in the northern latitudes. This is a typical pattern for this time of year, which follows the die-off of vegetation in winter when soil and plants release carbon dioxide into the atmosphere. Much of the regional variability seen in this map is due to weather patterns that move higher concentrations of carbon dioxide from Earth's surface into and out of the mid-troposphere where the AIRS instrument detects carbon dioxide best. The concentration of carbon dioxide in the mid-troposphere lags the concentration found at the surface as mixing from the lower to upper altitudes usually takes days to weeks. In addition, changes in concentration of carbon dioxide at Earth's surface are not always carried up to higher altitudes.
Image and caption courtesy of the AIRS Science Team at the NASA Jet Propulsion Laboratory.